
Twenty-One Miles Wide — The Full Research Note
Before the war, about a fifth of the world’s oil passed through the Strait of Hormuz. This note explains why so much depends on one narrow stretch of water, what happened when the 2026 war closed it, who was hit hardest and how a single chokepoint pushes up prices far beyond the Gulf.
On a normal day before the war, 130 to 140 ships sailed through the Strait of Hormuz.1 In March 2026, the average was six.2 Seven months on, in the week to 18 October, more oil left the Middle East than before the fighting began. Yet a barrel of Gulf crude cost more than five times as much to ship to Asia.3,4 This note explains how both can be true, and why a strait just 21 nautical miles wide can move prices around the world.
The short answer is geography. The Gulf’s oil and gas have very few ways out, and the ones that exist are small, exposed or both. When the main route closes, the world loses barrels. It also pays far more to move the barrels it still gets.
01 — The PuzzleMore Oil, Still Expensive
By the third week of October, the oil had found its way out. The ship-tracking firm Kpler estimated that Middle East oil shipments averaged more than 24 million barrels a day in the week to 18 October, above the pre-war average of 23.3 million.3 The recovery ran on an improvised system: bigger pipeline exports, short tanker runs through the strait under US protection, and cargoes passed from ship to ship in the Gulf of Oman.3
None of that made oil cheap. Dated Brent, the benchmark for physical cargoes, was still around $134 a barrel in mid-October.5 Shipping crude from the Gulf to Asia on a large tanker cost more than $37 a barrel, over five times the pre-war rate.4 For a very large crude carrier (VLCC) holding 2 million barrels, that is more than $74 million for a single cargo, against less than $15 million before the war.3
The world also had far less oil in reserve. At the end of September, observed global stocks were 509 million barrels below their level at the end of February.5
Three things explain why oil can move again without getting cheaper: how much depends on the strait, how little the alternative routes can carry, and the way a chokepoint turns danger into cost. This note takes each in turn, then looks at who was hit hardest and what to watch next.
02 — The BasicsWhy One Strait Matters So Much
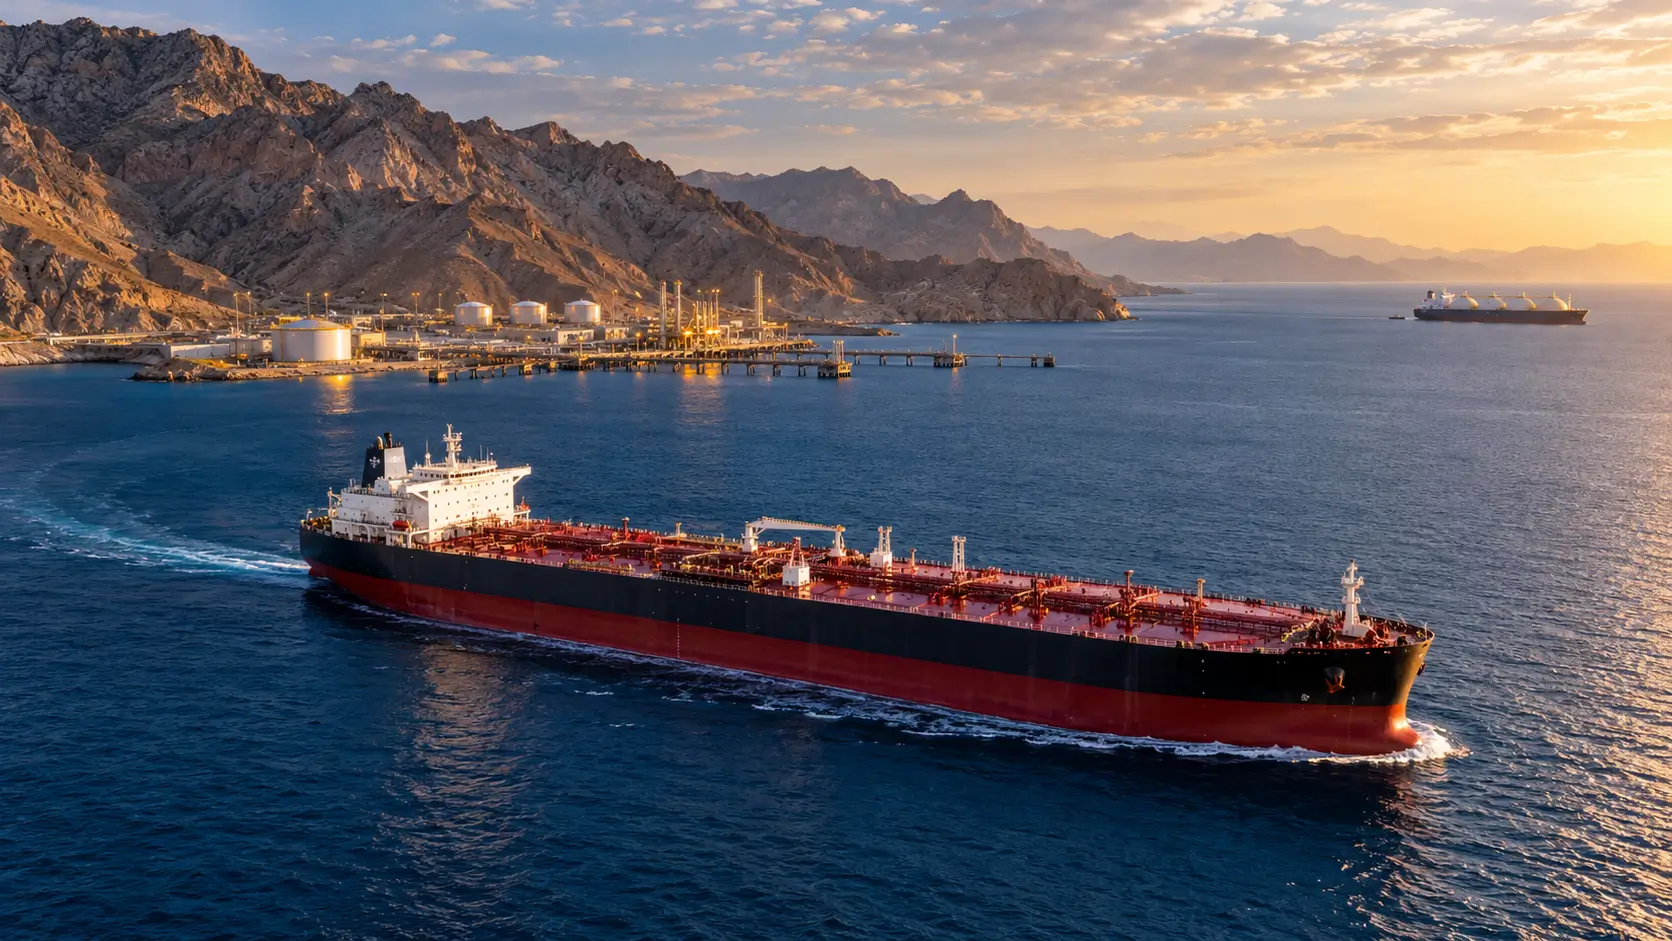
The Strait of Hormuz links the Persian Gulf to the Gulf of Oman and the Arabian Sea. At its narrowest point, between Iran and Oman’s Musandam Peninsula, it is about 21 nautical miles (39 km) across.6 The shipping lanes are much narrower: one two-mile lane for ships coming in, one for ships going out, and a two-mile buffer between them.7 For most of the oil that uses the strait, there is no other way out of the region.8
The volumes are huge. In 2025, an average of 19.9 million barrels a day (mb/d) of oil crossed the strait: 15.0 mb/d of crude oil and condensate and 4.9 mb/d of refined products. That was around a quarter of all the oil traded by sea.7 The US Energy Information Administration (EIA) puts the flow at the equivalent of about 20% of the world’s oil consumption.8

Oil is only part of the story. About a fifth of all the LNG traded between countries also normally passes through the strait, most of it from Qatar.8 So does about a third of the world’s seaborne fertilizer trade, including 34% of its urea, 23% of its ammonia and nearly 20% of its phosphate exports.9 A closure hits power stations, factories and farms, not just filling stations.
Most of these cargoes go east. In 2024, 84% of the crude oil and condensate and 83% of the LNG that crossed the strait went to Asia. China, India, Japan and South Korea together took 69% of the crude. The United States, by contrast, imported only about 0.5 mb/d of crude from the Gulf, roughly 7% of its crude imports.8
03 — The BypassThe Pipelines Around It, and Their Limits
Only two countries can move oil around the strait in any volume. Saudi Arabia’s East-West pipeline carries crude across the country to Yanbu on the Red Sea. Its normal capacity is 5 mb/d, and it was temporarily expanded to 7 mb/d in 2019. The UAE’s pipeline carries up to 1.8 mb/d from its onshore fields to Fujairah, on the Gulf of Oman.8
Before the war, the EIA estimated that about 2.6 mb/d of this capacity was unused and available in a crisis.8 The IEA put the figure higher, at 3.5 to 5.5 mb/d.7 Even the higher number is less than a third of the oil that normally crosses the strait.
In 2026, the pipelines were pushed hard. Exports from Yanbu and Fujairah rose from 4.1 mb/d in February to a peak of 7.8 mb/d in June. By August, the IEA reckoned, the extra flows had made up for more than 500 million barrels of lost Hormuz exports, an average of about 2.8 mb/d.10
But the alternative routes were exposed too. Houthi attacks in the Red Sea cut bypass exports back to 5.5 mb/d in August, and attacks on the East-West pipeline shut it down in early September.10 Flows through Hormuz itself averaged just 7.6 mb/d in August, 13.1 mb/d below their pre-war level. By then, export losses through the strait added up to nearly 2.8 billion barrels.10

The pipelines also helped some countries far more than others. Saudi Arabia and the UAE own them. Kuwait, Qatar and Bahrain have none. Tim Callen, a former head of the IMF’s Gulf Cooperation Council division, describes their reliance on the strait as “near total.”11 That single fact explains much of who suffered most, as section 05 shows.
04 — The ClosureEight Months of Disruption
The war began on 28 February, when the United States and Israel launched strikes on Iran. Iran retaliated with strikes on targets in several countries, and its threats and attacks soon brought shipping through the strait almost to a halt.12 The parties to the conflict give very different accounts of why it started. This note does not try to settle that question. It looks at what the disruption did to shipping, trade and prices.
Estimates of the collapse vary, because trackers count ships in different ways. Argus Media put the historical average at 138 ships a day.13 UNCTAD, using Clarksons data, counted around 130 a day in February and six a day in March, a fall of about 95%.2 IMF PortWatch, which counts container ships, bulk carriers, general cargo ships, ro-ro vessels and tankers, recorded 78 a day in February and about three a day in March.14
Ships in and around the strait were soon under fire. The UK Maritime Trade Operations center recorded 23 attacks on vessels between 1 March and 29 April.15 By April, an estimated 1,000 ships were in a holding pattern: 800 inside the Gulf waiting to get out, and 200 outside waiting to get in.15 The International Maritime Organization (IMO) said around 20,000 seafarers were stranded on board.16

A ceasefire, a deal and a breakdown
A ceasefire took effect on 8 April but brought little relief. Only 45 ships entered or left the strait in the days that followed,18 and PortWatch’s seven-day average was about seven a day in mid-April.14 Within days, the US had announced a blockade of ships entering or leaving Iranian ports.15
The memorandum of understanding signed on 17 June went further. It extended the ceasefire by 60 days, and it committed Iran to reopening the strait gradually and the US to lifting its blockade.19 Kpler counted at least 172 ships through the strait in the days that followed, and war-risk insurance rates fell from about 5% of a ship’s value to around 2%.20 PortWatch recorded 51 crossings on 24 June, the busiest day since the war began.14
Oil moved faster than the ship counts suggest, because large tankers carry a great deal and many sailed with their transponders switched off.17 By the start of July, Gulf oil loadings had peaked at 20 mb/d.21
The recovery lasted about three weeks. The ceasefire broke down on 7–8 July.22 Three ships were attacked that week, and insurance rates rose again.23 Gulf loadings fell to around 12 mb/d later in the month.21 By August, the IEA listed the Hormuz shutdown, the US blockade of Iranian exports and attacks in the Bab el-Mandeb Strait among the reasons global supply had fallen well below demand.24
Autumn: more oil, more danger
By late August, at least 70 commercial vessels had been attacked in the region since February, and 19 seafarers had been killed, according to IMO figures. Some 6,000 seafarers were still stranded in the Gulf.25 USNI News reported that the deaths resulted from both US and Iranian attacks on commercial ships.26 In September and the first half of October, PortWatch recorded an average of fewer than four crossings a day.14
Even so, more oil got out by other means. In September, Gulf crude exports, led by Saudi Arabia, jumped by 4.4 mb/d to 13.9 mb/d.5 By mid-October, flows through Hormuz, including ship-to-ship transfers offshore, were back to about 82% of their pre-war level.3 The attacks continued as well. In October, a Singapore-flagged container ship, the GFS Pride, sank after being hit by a projectile in the strait.27
05 — The ProducersGulf Exporters Hit Hardest
High oil prices usually help exporters. This time, the exporters that could not get their oil out lost the most. In its October outlook, the IMF forecast that Kuwait’s economy would shrink by 16.7% in 2026, Iraq’s by 16.0%, Qatar’s by 15.6% and Bahrain’s by 11.3%. Iran’s economy, under blockade and sanctions, is expected to shrink by 7.6%.28,29 The IMF names Bahrain, Iraq, Kuwait and Qatar as the producers most affected by disruption to energy output and transport.29

Saudi Arabia is expected to shrink by only 3.3%, and the UAE by 3.9%. The IMF counts Saudi Arabia among the least affected economies in the region, pointing to its more diversified export routes. Oman is the only Gulf economy expected to grow this year.29
Qatar was hit twice. QatarEnergy halted LNG production after drone attacks and declared force majeure on 4 March, telling buyers it could not meet its contracts. Qatar supplies around 20% of the world’s LNG exports, and all of it normally passes through the strait.31 Then, on 18 and 19 March, missile strikes that QatarEnergy attributed to Iran damaged two of its 14 LNG production units at Ras Laffan. QatarEnergy expects about 17% of its export capacity, 12.8 million tonnes a year, to stay offline for three to five years. It puts the lost revenue at about $20 billion a year.32
Trade data show how wide the damage was. In April, exports of 12 key products from the seven economies that depend on Hormuz fell 54% by volume from a year earlier. LNG exports fell 95%, and urea exports 83%.33
06 — The ImportersAsia Feels the Shortage
Outside the Gulf, the damage followed the map of dependence. Japan bought more than 90% of its crude from the Middle East. In April, its crude imports from the region fell 67.2% from a year earlier, to the lowest level since records began in 1979. Its LNG imports from the region fell 76.1%. Tokyo responded with its biggest-ever release of oil from its strategic reserves.34
China saw the largest drop in oil demand of any country. Its seaborne crude imports fell from 11.5 mb/d in February to 6 mb/d in June, and its apparent oil demand ran 1.7 mb/d below February levels.10 In September alone, crude stocks outside the OECD fell by 76 million barrels, and China accounted for 78% of the fall.5
South Asia’s fuel and gas squeeze
South Asia was squeezed on gas as well as oil. In 2025, Pakistan bought almost all of its LNG, 6.6 million tonnes, from Qatar. Bangladesh got 63% of its LNG from Qatar and the UAE, and India got 59%. As buyers competed for the few spare cargoes, spot LNG prices rose above $20 per million British thermal units.35
Governments turned to rationing. On 9 March, as oil passed $100 a barrel, Pakistan’s prime minister announced a two-week closure of schools and ordered half of government staff to work from home to save fuel.36 Bangladesh cut gas to CNG filling stations for four hours a day, and its textile and garment makers faced significant cuts in production.35
From fertilizer to food
Fertilizer carried the shock into food. Shipments out through the strait effectively stopped when the conflict began.9 In April, urea exports from the economies that depend on Hormuz were 83% lower than a year earlier.33 Urea prices more than doubled, from about $400 a tonne before the war to over $850 in April. By June they had fallen back to about $453, as some shipping resumed and China reopened its urea exports.9
What softened the blow
The shock could have been much worse. IEA member countries released more than 300 million barrels of emergency stocks under a joint action announced on 11 March.10 In October, the IEA agreed to speed up the release of about 100 million barrels of emergency stocks, including more than 20 million barrels of diesel.27 Producers outside the Gulf added 2.3 mb/d of supply between February and August, led by the United States (+520,000 b/d), Brazil (+470,000 b/d) and Kazakhstan (+440,000 b/d).10
High prices also cut demand. Over the six months to August, world oil demand averaged 5.8 mb/d below its February level.10 The IEA now expects demand to fall by 2.6 mb/d over 2026 as a whole.27
Some exporters outside the region gained. In April, the IMF’s chief economist, Pierre-Olivier Gourinchas, said that “the US at the margin is benefiting from higher energy prices,” even though American drivers were paying more at the pump.37
07 — The PricesFour Ways the Shock Spread
Many countries never buy a barrel that has crossed Hormuz. Almost all of them still paid for the closure, through four channels.
1. Lost barrels. Oil is traded in one global market, so a shortage anywhere raises prices everywhere. By April, global supply losses since February had reached 12.8 mb/d, and output from the Gulf countries affected by the closure was 14.4 mb/d below pre-war levels.38 Brent averaged $70.89 a barrel in February, $103.13 in March and $117.29 in April.39 Prices fell just as fast when the strait looked set to reopen: by early July, North Sea Dated was $68 a barrel, $2 below its pre-war level.22 When the ceasefire collapsed, Brent climbed again, to an average of $114.16 in September.39

2. The rush for prompt cargoes. When refiners need crude now, physical barrels can trade far above futures. Dated Brent hit a record $144.42 a barrel on 7 April. Two days later, after the ceasefire, it was still near $132. Brent futures for June delivery, by contrast, were trading at about $96.50.40 In mid-October, Dated Brent was still about $134.5 The two prices measure different things. Futures are for oil delivered later; Dated Brent is for cargoes loading within weeks. A wide gap between them means real barrels are scarce.
3. The cost of the journey. Before the conflict, war-risk insurance usually cost less than 1% of a ship’s value for a voyage through the strait.41 During the war it briefly reached 10%, and by July around 5% had become the market norm.23 Freight costs soared too. By mid-October, shipping crude from the Gulf to Asia on a large tanker cost more than $37 a barrel, over five times the pre-war level.4
The squeeze reached routes far from the Gulf. Shipping West African crude to Europe on a Suezmax tanker cost over $22 a barrel, more than four times the pre-war level, and North Sea Aframax rates tripled. Asian refiners, which rely most on Gulf crude, were hit hardest, because transport costs can decide whether a refinery makes or loses money.4
4. Fuel, and everything it moves. Diesel, which powers trucks, trains, farm machinery and generators, was hit especially hard. In September, global diesel exports were 700,000 b/d lower than a year earlier.5 In the US, diesel averaged $6.29 a gallon that month and gasoline $4.35.42 From there, the costs spread into freight, food and almost everything else.
The economic bill is large. The IMF expects global inflation of 4.7% in 2026, and says energy-importing economies outside the technology supply chain face the hardest outlook.30 In April, UNCTAD expected growth in world merchandise trade to slow from about 4.7% in 2025 to between 1.5% and 2.5% in 2026. It said developing economies would be hit hardest, as weaker currencies make imported fuel and food more expensive.2 The same pressures help explain why oil climbed above $125 this autumn. As we showed in The Price of Plastic, plastic prices stayed calm anyway, because that market was already oversupplied.43
08 — The OutlookWhat to Watch Next
No one expects a quick return to normal. The IMF now assumes the strait will begin to reopen gradually from March 2027, with pre-war conditions fully restored by October 2027.44 The EIA expects Middle East oil flows to stay constrained through the end of 2026. It forecasts Brent at an average of $105 a barrel in the fourth quarter, $96 for 2026 as a whole and $84 in 2027.42 The IEA has warned that the global diesel shortage could last well into 2027.27
Five signals worth tracking
Daily crossings. Counts from IMF PortWatch and commercial trackers are the simplest test of whether the strait is really open.
War-risk insurance. Premiums show whether shipowners think the route is safe. A fall toward pre-war levels would say more than any announcement.
Tanker rates. The cost of shipping crude from the Gulf to Asia shows how much of the oil price is really the cost of the journey.
The gap between Dated Brent and futures. A wide gap means physical barrels are still scarce.
The bypass routes. The state of the East-West pipeline, Fujairah and Red Sea shipping shows how much oil could still get out if the strait closed again.
Lessons for the next disruption
For importers, 2026 showed the value of strategic stocks and of buying from more than one region. For exporters, it showed that a pipeline around the strait is worth far more than its daily capacity suggests. For businesses everywhere, it was a reminder that freight and insurance can move the cost of energy as much as the price of the fuel itself.
The TakeawayThe Price of a Narrow Strait
The Strait of Hormuz is just 21 nautical miles wide at its narrowest point, and in 2026 the world learned what that means. Closing it did more than remove barrels. It made every remaining barrel slower, riskier and more expensive to move, and that cost reached refiners, drivers, farmers and factories thousands of miles away.
The Gulf producers that depend on the strait paid the most. Asian importers came under heavy strain. Everyone else paid through higher prices. As long as one narrow channel carries a fifth of the world’s oil, the number to watch is not just the price of a barrel, but the cost and the risk of getting it out of the Gulf.
Reading options
Need the concise version?
Return to the six-minute brief or browse the complete collection of research articles.