
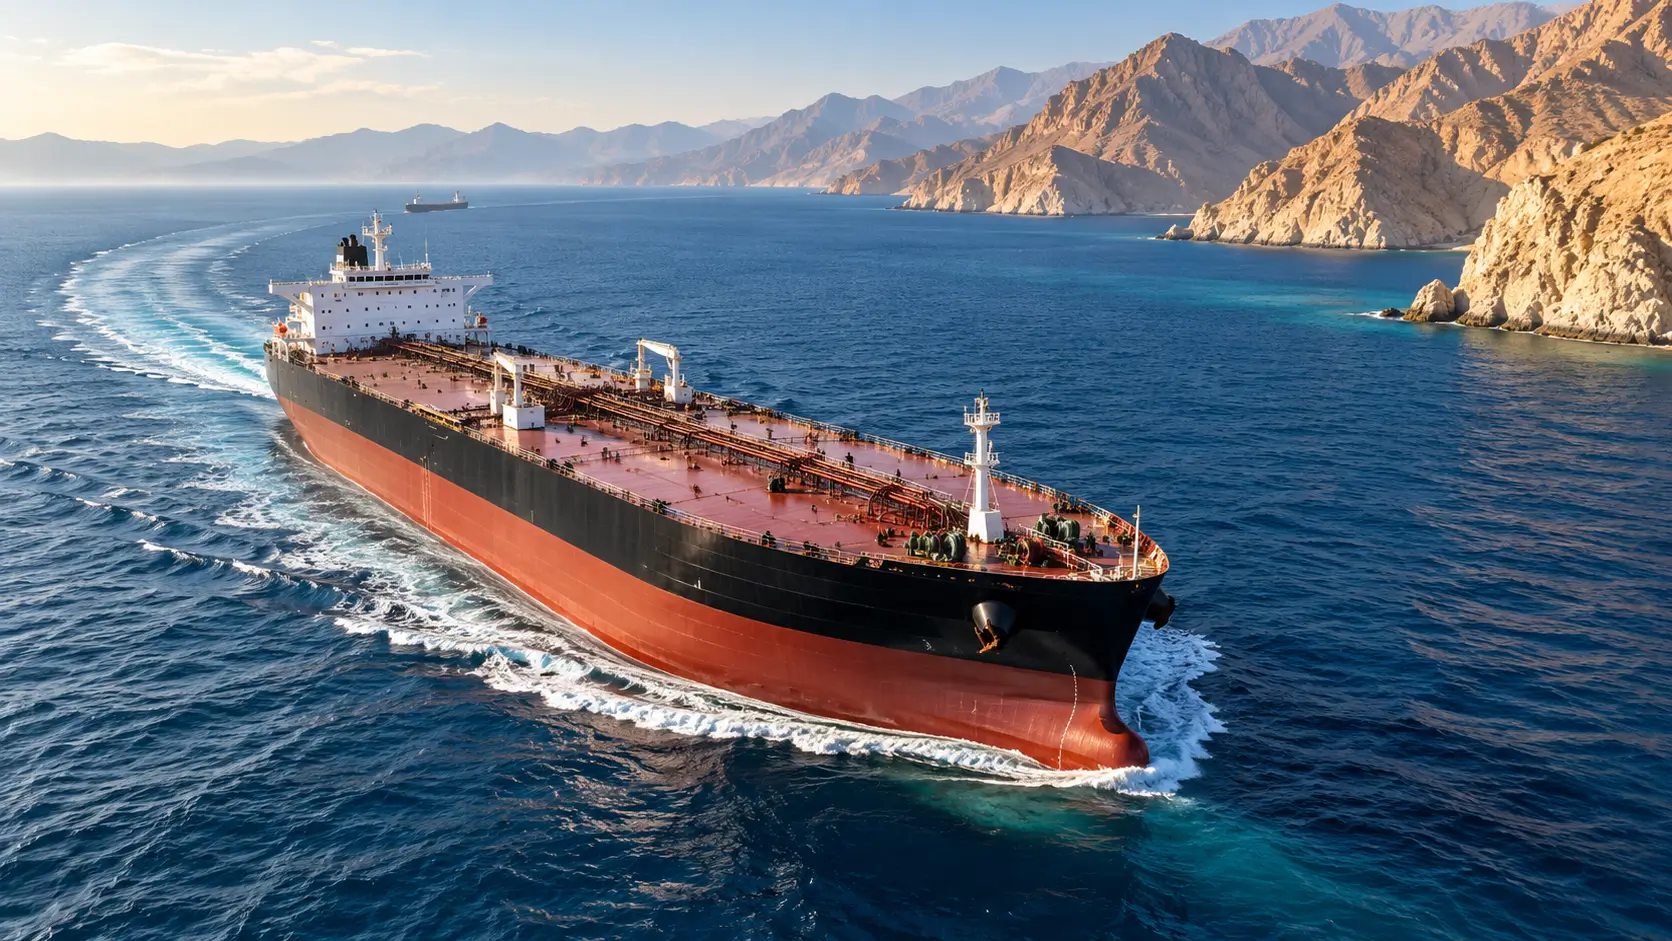
Twenty-One Miles Wide
Before the war, about a fifth of the world’s oil passed through one narrow strait. When war closed it in 2026, shipping stopped almost overnight, the Gulf economies that depend on it went into reverse and Asia scrambled for fuel. Oil is moving again, but getting it out of the Gulf still costs far more than it did, and the whole world is paying for that.
On a normal day before the war, 130 to 140 ships sailed through the Strait of Hormuz.1 In March 2026, the average was six.2 Seven months on, the oil is moving again. In the week to 18 October, the Middle East exported more oil than it did before the war. Yet shipping a barrel of Gulf crude to Asia cost more than five times as much.3,4 Oil can flow and still be expensive. That is what a chokepoint does.
At its narrowest point, the strait is just 21 nautical miles across, and large ships use two lanes, each two miles wide.5,6 Through that gap, the Gulf normally ships the equivalent of about a fifth of the oil the world uses, and a fifth of all the liquefied natural gas (LNG) traded between countries.7 When the strait closes, very little can take its place.
01 — The GeographyA Narrow Gate for a Fifth of the World’s Oil
In 2025, nearly 20 million barrels a day of crude oil and fuels passed through the strait, around a quarter of all the oil traded by sea. Saudi Arabia shipped the most, at 6.2 million barrels a day, followed by Iraq, the UAE, Iran and Kuwait.6
Most of it goes east. In 2024, 84% of the crude and 83% of the LNG that crossed the strait went to Asia. China, India, Japan and South Korea alone took 69% of the crude.7
There are only two real ways around. Saudi Arabia can pipe crude west to the Red Sea, and the UAE can pipe it to Fujairah, which lies outside the strait. Before the war, the International Energy Agency (IEA) estimated that these routes had 3.5 to 5.5 million barrels a day of spare room, less than a third of what normally passes through.6 Kuwait, Qatar and Bahrain have no such route. Their reliance on the strait is close to total.8
02 — The ClosureFrom 130 Ships a Day to Six
The war began on 28 February, when the United States and Israel launched strikes on Iran. Iran retaliated with strikes on targets in several countries, and its threats and attacks soon brought shipping through the strait almost to a halt.9 Daily crossings fell by about 95%, from around 130 in February to six in March.2 By April, roughly 1,000 ships were waiting to cross, 800 of them stuck inside the Gulf.10 Around 20,000 seafarers were trapped on board.11
A ceasefire on 8 April changed little. Only 45 ships crossed in the days that followed,12 and within a week the US had started a naval blockade of Iranian ports.10
A deal signed on 17 June did more. It extended the ceasefire, and it committed Iran to reopening the strait gradually and the US to lifting its blockade.13 By the start of July, Gulf oil loadings had climbed to 20 million barrels a day.14 The recovery lasted about three weeks. The ceasefire broke down on 7–8 July,15 and loadings fell to about 12 million barrels a day later that month.14 In September and the first half of October, IMF PortWatch, which tracks cargo ships and tankers by satellite, counted an average of fewer than four crossings a day.16

Oil found other ways out. Saudi Arabia and the UAE pushed more crude through their pipelines. Tankers made short runs through the strait under US protection and passed their cargoes to other ships in the Gulf of Oman.3 Gulf crude exports jumped by 4.4 million barrels a day in September alone.18 In the week to 18 October, Middle East oil shipments averaged more than 24 million barrels a day, above the pre-war average of 23.3 million. Flows through Hormuz itself, though, were still only about 82% of normal.3
03 — The DamageWho Was Hit Hardest
The biggest losses fell on the Gulf producers that rely most on the strait. In October, the IMF forecast that Kuwait’s economy would shrink by 16.7% this year, Iraq’s by 16.0%, Qatar’s by 15.6% and Bahrain’s by 11.3%.19 Saudi Arabia, which could send crude west to the Red Sea, is expected to shrink by a much smaller 3.3%.20
Outside the Gulf, Asia was the most exposed. The IEA expects the Middle East and Asia to account for about 80% of this year’s fall in oil demand.21 Japan bought more than 90% of its crude from the Middle East. In April, its crude imports from the region fell 67% from a year earlier, to the lowest level since records began in 1979.22
South Asia was hit through gas as well as oil. In 2025, Pakistan bought almost all of its LNG from Qatar, and Bangladesh bought 63% of its LNG from Qatar and the UAE.23 In early March, QatarEnergy stopped production and declared force majeure, telling buyers it could not meet its contracts.24 Later that month, missile strikes that QatarEnergy attributed to Iran knocked out about 17% of its export capacity for an expected three to five years.25 Bangladesh cut gas to CNG filling stations for four hours a day.23
Oil prices bit as well. In Pakistan, as oil passed $100 a barrel, the government closed schools for two weeks and told half of its staff to work from home to save fuel.26
Food was hit too. The strait normally carries about a third of the world’s seaborne fertilizer trade, including 34% of its urea. Urea prices more than doubled, from about $400 a tonne before the war to over $850 in April. They eased once some shipping resumed and China restarted its exports.27
04 — The PricesWhy Everyone Paid More
Oil is traded in one global market, so a shortage in one place raises prices everywhere. Brent crude averaged $70.89 a barrel in February, $103.13 in March and $117.29 in April. It fell back to $85.40 in June and $83.76 in July, as hopes of a deal grew and tankers began to move. When the fighting resumed, it climbed again, to $114.16 in September.28,15

Oil for prompt delivery cost even more. Dated Brent, the price of physical cargoes in the North Sea, hit a record $144.42 a barrel on 7 April.29 In mid-October it was still around $134.18 This is the squeeze that, as we noted in The Price of Plastic, pushed oil above $125 this autumn.
Moving oil also became far more expensive. Before the war, war-risk insurance usually cost less than 1% of a ship’s value per voyage.30 During the war it briefly reached 10%, and by July about 5% had become the norm.31 Tanker rates hit records too. By mid-October, shipping a barrel of crude from the Gulf to Asia on a large tanker cost more than $37, over five times the pre-war rate. Asian refiners took the biggest hit.4
Those costs flow on into fuel, freight and food. The IMF expects global inflation of 4.7% this year.32 UNCTAD has warned that weaker currencies are making imported fuel and food more expensive for developing countries.2
The TakeawayThe Price of a Narrow Strait
Hormuz shows that a chokepoint does not have to stop every barrel to raise prices everywhere. It only has to make each barrel slower, riskier and more expensive to move. The Gulf producers that depend most on the strait suffered worst. Asian importers came under heavy strain. Everyone else paid through higher prices. The IMF does not expect the strait to begin reopening until March 2027. The full research note covers the pipelines around the strait, the complete 2026 timeline, what softened the blow and the signals worth watching.
Continue the research
Read the complete research note.
Open the extended analysis for the complete argument, evidence, charts and source references.